Harnessing data to reduce road collisions
With traffic responsible for the deaths of more than 1.25 million people worldwide, and another 20-30 million injuries, the need to improve road safety is higher than ever.
Over half of people killed in crashes are not in vehicles; with pedestrians, cyclists and motorbike riders all at risk of being involved in a serious collision. But deaths and injuries are just the tip of the ‘Injury Iceberg’, lurking just below the surface are countless near misses, close calls, and “evasive maneuvers”.
In order to help reduce the number of incidents, cities around the world are adopting Vision Zero (VZ) policies in an attempt to fundamentally rethink the safety of their streets. Originating from Sweden, the Vision Zero initiative focuses on implementing a safe highway system where there are no fatalities or serious injuries caused by vehicles by developing a way of understanding the behaviour of drivers before crashes occur.
But what if we could systematically analyse these ‘almost-collisions’ to identify patterns and trends, and increase safety?
Enter the smartphone. Most phones generate data huge volumes of data every second, even while resting patiently on your dashboard. You phone’s GPS knows where you are right now, how fast you’re moving, when and which way you turn, when you’ve picked up the phone, and when you stop. Like breadcrumbs in the cloud, we are all spreading data every second of every day we have our phones with us.

However, to turn data into something that can help improve road safety required some significant smarts. To achieve the vision of an easy to use app that could make a significant impact, Buro Happold collaborated with Zendrive. Zendrive develops smartphone powered road safety analytics, to create a system that would analyse driving data and identify patterns and trends, with the aim of increasing safety. ZenDrive provided us with information collected from drivers in New York to use as sample data for our system.
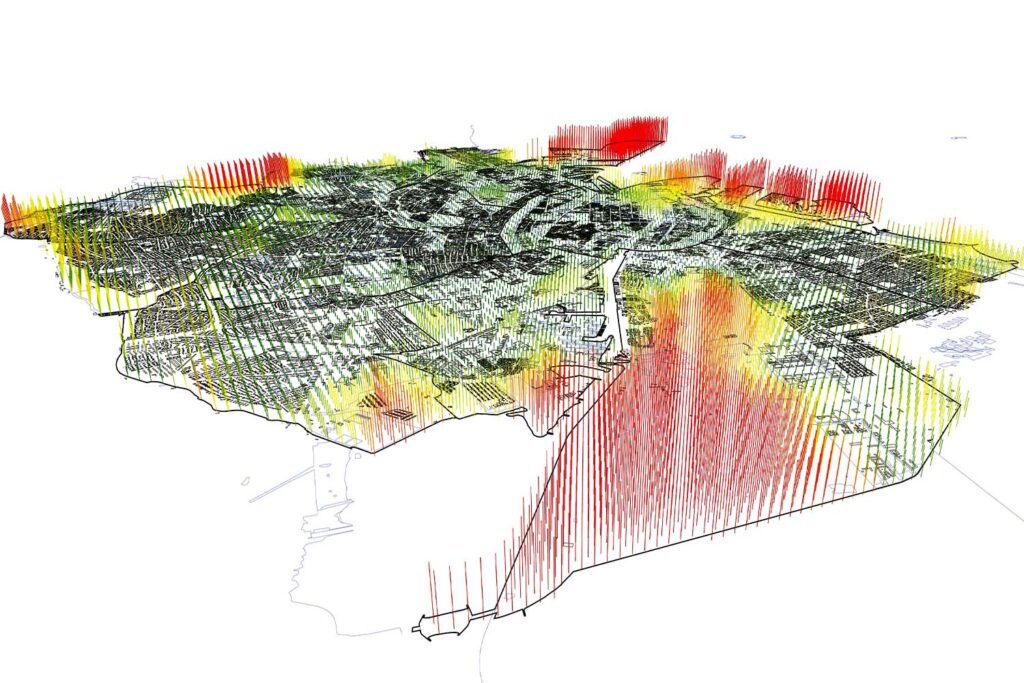
Using the data collected from Zendrive, we utilised software developed in-house by our Analytics team to analyse it. The software provides an interactive dashboard that displays driving behaviour data as clickable points on a map and makes it possible to track correlations. Once installed on a smartphone, it uses the phone’s GPS system to analyse real-time events, including origin and destination, trip distance and route, speed and acceleration, braking and distracted driving. With the aim of providing data to create safer streets as opposed to prosecuting individuals, data is collected anonymously, giving an overall impression of how the city’s road systems are being used.
Zendrive’s live stream of driving and driver behaviour data, combined with Buro Happold’s data analytics and road safety expertise allows cities to substantially accelerate progress towards Vision Zero. The portal provides quick insights into a large and otherwise hard-to-read set of data. The user can easily see mobility patterns, congestion areas, and danger hot spots. The 4D aspect allows the user to constantly monitor the situation and react to incidents and patterns immediately.
Not many people would think that a hard break in a messy intersection could be anything more than that, but together with other similar instances it can inform city planners that this intersection isn’t working correctly. Together with data from similar junctions, this can pinpoint what exactly isn’t working, and all of a sudden your hard break is part of the data that helps us build safer roads and save lives!

Related content

EJNYC: New York City’s Environmental Justice Report

Canning Town Estates Regeneration

What’s next given the SEC Climate Rule freeze?

Buro Happold supports New York Mayor’s Office with release of ‘EJNYC Report’ on Climate, Environmental Justice

RCRC Operational Framework Project